
Nature's Nanotech: Graphene and Blue Emission Found in Bee Hives
Researchers discover naturally formed graphene sheets and carbon ovals in stingless bee hives, creating a novel emergent material with powerful blue light...
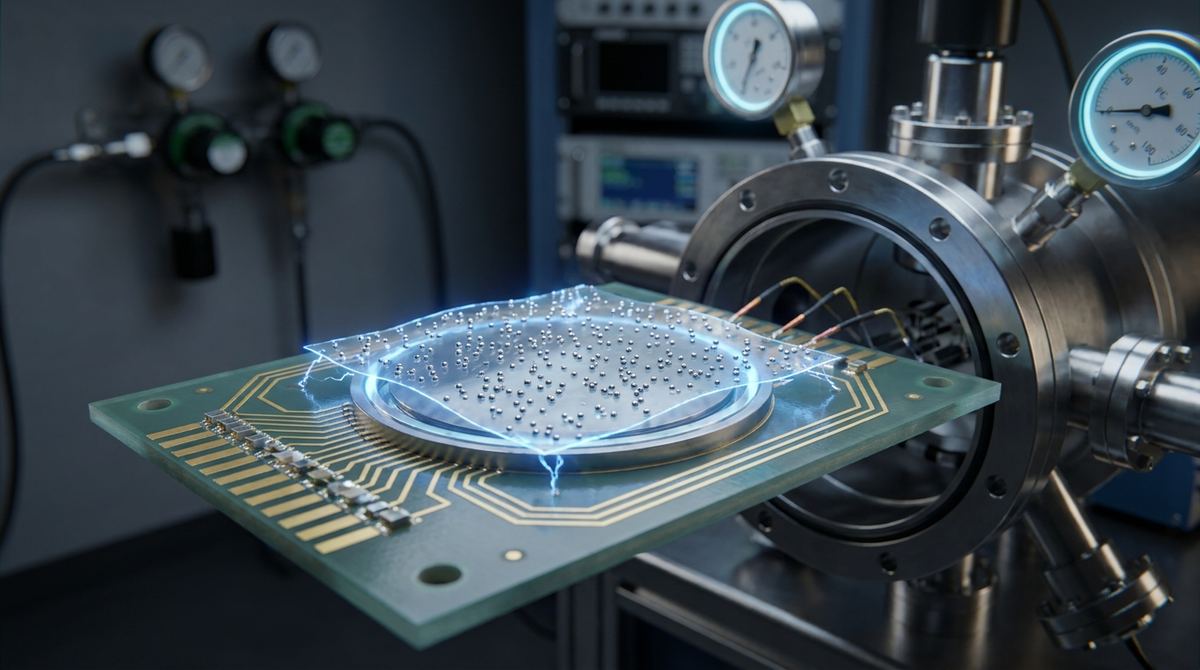
Hydrogen sensing is a critical requirement for the safety and efficiency of the burgeoning hydrogen economy, particularly in fuel cell vehicles and industrial storage facilities. While traditional metal-oxide sensors exist, they often suffer from high operating temperatures and slow recovery times. Graphene-based chemiresistive sensors offer a path toward room-temperature, high-speed sensing, but pristine graphene is notoriously poor at detecting hydrogen directly.
To solve this, we use a technique called functionalization, where we decorate the graphene surface with catalytic metal nanoparticles. This guide focuses on using platinum (Pt) to create a high-performance hydrogen sensor. By leveraging the catalytic properties of platinum, we can convert a chemical signal (hydrogen gas) into a measurable electrical signal (change in resistance) through the graphene transducer.
It is a common misconception that the hydrogen gas interacts directly with the graphene to create a signal. In a platinum-functionalized system, the mechanism is more nuanced.
The platinum nanoparticles act as catalytic sites. When hydrogen molecules (H2) come into contact with the platinum, the metal facilitates dissociative chemisorption, meaning the H2 molecule splits into two individual hydrogen atoms (H) on the surface of the platinum.
Crucially, the research indicates that these hydrogen atoms do not significantly spill over onto the graphene itself. Instead, the presence of adsorbed hydrogen on the platinum clusters alters the electronic interaction between the platinum and the graphene. This interaction, which is primarily non-covalent and involves charge transfer and local strain, changes the carrier density in the graphene. This change in carrier density results in a measurable shift in the graphene's electrical resistance.
An important engineering insight from recent molecular dynamics simulations is the role of platinum morphology in doping. Small, under-coordinated platinum clusters tend to induce n-type doping in the graphene. However, if the platinum coverage becomes too high and forms a continuous film, the doping effect shifts to p-type. Controlling this morphology is the key to tuning your sensor's baseline resistance.
To build a prototype, you will need the following components. Note that for a professional lab setting, CVD-grown graphene is preferred, while makers may need to rely on liquid-phase exfoliated flakes.
1. Graphene Substrate: Silicon/Silicon Dioxide (SiO2/Si) wafers are the standard for prototyping. For flexible applications, use a polyimide substrate.
2. Platinum Source: A physical vapor deposition (PVD) system, such as an electron-beam evaporator or a sputter coater, is required for precise control over metal loading.
3. Contact Electrodes: Gold (Au) or Palladium (Pd) for the electrical interconnects to ensure low contact resistance.
4. Gas Delivery System: A controlled flow setup using mass flow controllers (MFCs) to deliver hydrogen (diluted in nitrogen or air) at precise concentrations.
5. Measurement Electronics: A high-precision Source Measure Unit (SMU) or a sensitive electrometer to detect small resistance changes.
6. Environmental Chamber: A sealed testing chamber to control gas concentration and humidity.
The following steps outline the process for creating a functionalized graphene sensor.
1. Substrate Preparation: Clean your SiO2/Si substrate using standard RCA cleaning or a piranha etch to ensure no organic contaminants interfere with graphene adhesion.
2. Graphene Deposition:
- For high-performance prototypes, use Chemical Vapor Deposition (CVD) to grow high-quality graphene on copper foil, then transfer it to your target substrate.
- For rapid prototyping, use liquid-phase exfoliation to drop-cast graphene flakes onto the substrate, though be aware that this results in a much more disordered network.
3. Contact Patterning: Use photolithography or electron-beam lithography to define electrode patterns. Deposit your gold or palladium contacts via thermal evaporation.
4. Platinum Functionalization: This is the most critical step. You must deposit platinum onto the graphene to create discrete nanoclusters rather than a continuous film.
- Use a sputter coater or e-beam evaporator.
- The thickness of the platinum layer must be controlled with extreme precision. Since the research suggests that intermediate loading is optimal, you should target a thickness range between 0.5 nm and 5 nm.
- If the layer is too thin, you will lack sufficient catalytic sites. If it is too thick, you will create a continuous film that shifts the doping type and reduces sensitivity.
5. Post-Deposition Annealing: A mild thermal anneal in a reducing atmosphere (such as H2/Ar) can help stabilize the platinum clusters and improve the metal-graphene interface.
The performance of your sensor is heavily dependent on the platinum loading. Based on recent data-driven simulations, you must balance three competing factors:
- Limit of Detection (LOD): The research shows that intermediate platinum loading minimizes the LOD. This means there is a specific amount of platinum that allows the sensor to detect the smallest possible concentrations of hydrogen.
- Response and Recovery Kinetics: Lower platinum loadings generally facilitate faster response and recovery times. If your application requires rapid switching (e.g., detecting transient leaks), you should lean toward lower, more dispersed platinum clusters.
- Signal Transduction: Higher platinum loading increases the doping level of the graphene. While this might seem beneficial for signal strength, excessive doping can saturate the sensor or shift the baseline resistance to a point where the relative change (delta R/R0) becomes too small to measure accurately.
Engineers should perform a parameter sweep of platinum thickness (e.g., 0.5, 1, 2, 3, 5, and 10 nm) to identify the optimal loading for their specific target gas concentration.
Once the prototype is fabricated, follow this testing protocol to validate performance.
1. Baseline Stability Test: Place the sensor in a controlled environment (pure N2 or air) and monitor the resistance over several hours. A stable baseline is essential for reliable sensing.
2. Sensitivity and LOD Determination: Introduce hydrogen at increasing concentrations (from 1 ppm up to 1000 ppm). Plot the relative change in resistance against the concentration. The LOD is typically defined as the concentration that produces a signal three times the standard deviation of the noise.
3. Response and Recovery Time: Measure the time it takes for the resistance to reach 90% of its new steady-state value (T90) upon exposure to hydrogen, and the time it takes to return to 10% of the baseline upon removal of the gas.
4. Selectivity Testing: Expose the sensor to common interfering gases such as CO, CH4, or humidity (H2O). A good sensor should show negligible response to these gases compared to the hydrogen signal.
5. Hysteresis and Repeatability: Cycle the gas exposure multiple times to ensure the sensor returns to the same baseline and provides consistent readings.
When implementing this design, keep the following risks and assumptions in mind:
- Assumption of Morphology: This guide assumes you can control the platinum morphology via deposition thickness. In practice, metal atoms tend to agglomerate (clump together) during fabrication or operation. You may need to use specialized deposition techniques or post-treatment to ensure the platinum remains as discrete clusters.
- Temperature Sensitivity: Graphene's resistance is temperature-dependent. While the sensing mechanism described is effective at room temperature, any significant temperature fluctuations in your operating environment will introduce noise. Thermal management or a temperature compensation circuit may be required.
- Oxidation and Degradation: While graphene is chemically stable, the platinum clusters can undergo surface oxidation or poisoning if exposed to sulfur-containing compounds or high humidity over long periods.
- Doping Shifts: As noted, the transition from n-type to p-type doping occurs as the platinum coverage increases. If your sensor's baseline resistance drifts significantly, it may be due to the formation of larger, continuous metal islands.
This guide is based on the research findings presented in:
"Data-Driven Molecular Dynamics and TEM Analysis of Crystal Growth and Hydrogen Sensing in Pt-Functionalized Graphene Chemiresistive Sensors" by Akram Ibrahim, Ahmed M. Hafez, Mahmooda Sultana, and Can Ataca (2025).
The engineering assumptions regarding deposition thickness and testing protocols are proposed based on standard semiconductor and sensor fabrication practices to make the research findings actionable for practical application.
Serious about B2B integration? Test our premium Pulsed Electrical Resistive Carbon Heating turbostratic graphene in your lab. 100g sample packs available now.
Explore More
Researchers discover naturally formed graphene sheets and carbon ovals in stingless bee hives, creating a novel emergent material with powerful blue light...

Discover how rippled graphene pores act as fluidic memristors, enabling advanced synaptic functionalities for the next generation of neuromorphic computing.

Learn how to use electromechanical responses in gapped graphene to measure electronic temperature and band gaps using traveling flexural waves.