
Rippled Graphene Pores for Neuromorphic Fluidic Memristive Devices
Discover how rippled graphene pores act as fluidic memristors, enabling advanced synaptic functionalities for the next generation of neuromorphic computing.
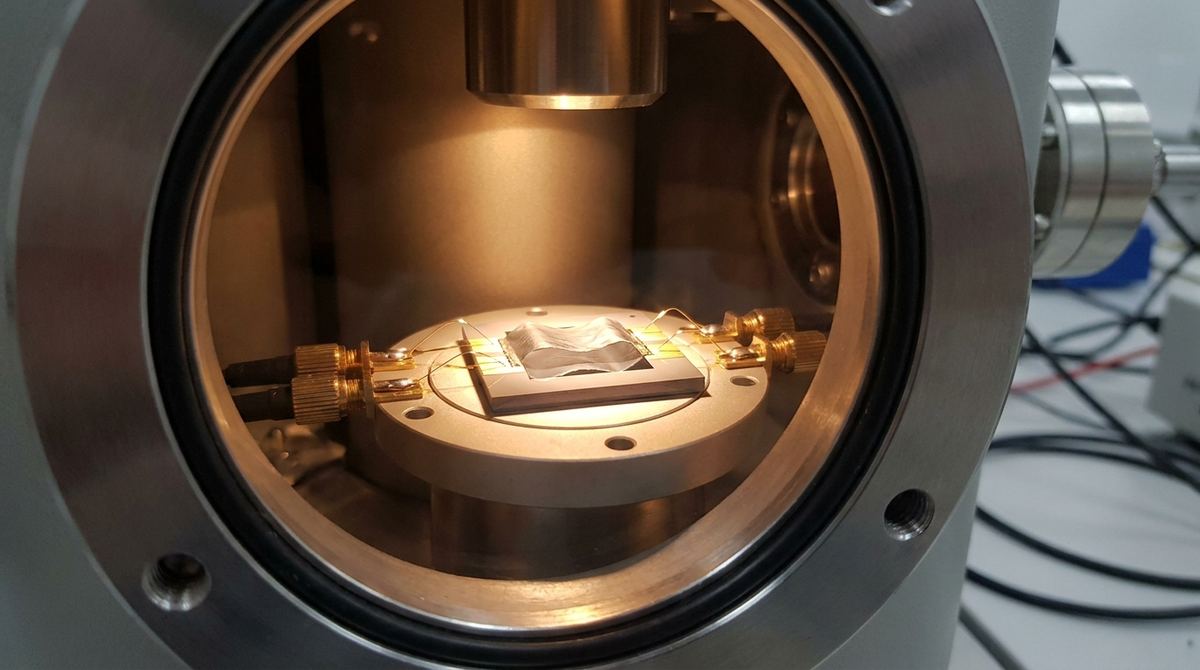
In the field of nanoelectronics, the ability to precisely measure the electronic properties of a material is just as important as the ability to manufacture it. For graphene, especially when it is engineered to have a bandgap, determining the exact size of that gap and the effective electronic temperature of the carriers is a significant challenge. Standard transport measurements often struggle to distinguish between thermal broadening and the intrinsic properties of the material when the system is near the band edge.
Recent research has identified a unique way to bypass these limitations by looking at how graphene responds to mechanical vibrations. When graphene is gapped—meaning it has a forbidden energy range for electrons—mechanical deformation creates an emergent gauge field. This field couples to the electrons in a way that produces a transverse electrical current. This is known as the anomaly-induced electromechanical response.
For engineers and lab researchers, this is not just a theoretical curiosity. It provides a new way to build highly sensitive characterization tools. By using traveling flexural waves (surface acoustic waves) to probe a graphene membrane, you can extract the bandgap and the electronic temperature by observing how the electrical signal changes as you sweep the gate voltage. This article provides a practical guide for building a prototype device capable of this measurement.
This technique falls under the broader category of /blog/category/electronics-photonics/ because it bridges the gap between mechanical acoustics and electronic transport.
To build a working prototype, you must understand what you are actually measuring. In standard graphene, the electrons behave like massless Dirac fermions. When you introduce a gap—typically by placing the graphene on a substrate like hexagonal Boron Nitride (hBN) or by using chemical doping—the electrons gain an effective mass.
When a mechanical wave, such as a surface acoustic wave (SAW), travels through this gapped graphene, it physically deforms the lattice. This deformation acts like a synthetic magnetic field for the electrons. Because of the specific symmetry properties of gapped graphene (specifically the parity anomaly), this mechanical wave drives a current that flows perpendicular to the direction of the wave.
The research by Sedrakyan and Ziegler (2026) highlights a critical detail for engineers: the temperature dependence. At absolute zero, the electrical response would show a sharp, discontinuous jump when the chemical potential (controlled by your gate voltage) crosses the band edge. However, at any finite temperature, this jump is smoothed into a continuous, universal crossover.
The shape of this smooth curve is determined by three variables: the temperature (T), the size of the energy gap (Delta), and the chemical potential (mu). By measuring the exact shape of this signal, you can mathematically back-calculate the temperature and the gap. This is a massive advantage over traditional methods because the signal is a direct consequence of the topological properties of the material, making it much more robust against standard electrical noise.
Building a device that can detect these tiny currents requires high-precision instrumentation and high-quality materials. You cannot use standard hobbyist electronics for this; you will need professional-grade laboratory /equipment/ to extract a signal that may be in the picoampere or nanoampere range.
The following list outlines the necessary components:
1. Substrate: A piezoelectric substrate is required to generate the mechanical waves. Lithium Niobate (LiNbO3) is the industry standard for SAW devices due to its high electromechanical coupling coefficient.
2. Graphene: High-quality, large-area graphene is essential. For high-precision work, graphene encapsulated in hBN is preferred to ensure the gap is well-defined and the carrier mobility is high.
3. Electrodes: Gold (Au) with a Titanium (Ti) adhesion layer is recommended for the interdigitated transducers (IDTs) and the electrical contacts.
4. Signal Generation: A high-frequency vector network analyzer (VNA) or a high-precision RF signal generator capable of driving the IDTs at the resonant frequency of the substrate.
5. Detection: A high-sensitivity lock-in amplifier is mandatory. This allows you to extract the specific frequency component of the current (either the fundamental frequency or the second harmonic) from the background noise.
6. Gate Control: A high-precision DC voltage source to control the back-gate or top-gate voltage, allowing you to sweep the chemical potential through the band edge.
7. Temperature Control: A cryostat or a specialized heating stage to vary the temperature and observe the smoothing of the crossover.
The construction of this device requires advanced nanofabrication techniques. You cannot simply glue graphene onto a substrate; the interface must be pristine to maintain the electronic properties required for the anomaly-induced response.
Step 1: Substrate Preparation
The Lithium Niobate substrate must be cleaned using standard RCA cleaning procedures to remove all organic and ionic contaminants. Any residue on the surface will dampen the mechanical waves and introduce noise into your electrical signal.
Step 2: Electrode Patterning
Using photolithography or electron-beam lithography, you must pattern the interdigitated transducers (IDTs) onto the substrate. These electrodes will convert the electrical signal from your generator into a mechanical surface wave. The finger width and spacing should be optimized for the target frequency (typically in the MHz to GHz range).
Step 3: Graphene Depstrate and Transfer
This is the most critical step in the /blog/category/graphene-production/ process. You will likely use a polymer-assisted transfer method (such as using PMMA). The graphene must be transferred onto the piezoelectric substrate, ideally with a thin layer of hBN between the graphene and the substrate to provide the necessary bandgap and protect the graphene from the substrate surface.
Step 4: Contact Metallization
Once the graphene is in place, you must pattern the electrical contacts. These contacts should be placed perpendicular to the direction of the SAW propagation. This geometry is essential because the anomaly-induced current flows transversely (perpendicular) to the mechanical wave.
Step 5: Encapsulation
To prevent environmental degradation and to provide a stable gate dielectric, the device should be encapsulated with a thin layer of hBN or Al2O3 via atomic layer deposition (ALD).
Once your prototype is assembled, you need a rigorous test plan to validate the signal and extract the material parameters. There are two primary ways to perform this measurement based on the research.
Method A: The Second-Harmonic Detection
In this method, you drive the device with a traveling flexural wave at a fundamental frequency (f). Because the mechanical wave creates a non-linear coupling with the electrons, the resulting transverse current will contain a component at the second harmonic (2f).
1. Apply a continuous wave (CW) signal to the IDTs at frequency f.
2. Set the lock-in amplifier to detect the signal at frequency 2f.
3. Sweep the gate voltage (V_g) across the suspected bandgap region.
4. Record the amplitude and phase of the 2f current.
Method B: The Fundamental-Frequency Detection
This method is more sensitive if you have a static ripple in your system. If the graphene has a static ripple (a permanent deformation), the interaction between the traveling wave and the static ripple will produce a signal at the fundamental frequency (f).
1. Apply a traveling wave at frequency f.
2. Ensure the device has a controlled static deformation (this can be achieved by mounting the substrate on a slightly curved surface).
3. Set the lock-in amplifier to detect the signal at frequency f.
4. Sweep the gate voltage (V_g) and record the signal.
Data Validation
To ensure you are seeing the anomaly-induced current and not just ordinary electromechanical noise, you must perform a temperature sweep. The research predicts that the signal shape is controlled by the ratio of temperature, gap, and chemical potential. If the signal shape changes in the specific, universal way predicted by the theory as you change the temperature, you have successfully isolated the anomaly-induced response.
The goal of the experiment is to extract the effective gap (Delta) and the electronic temperature (T). This is done by fitting the measured current-voltage (I-V) curve to the theoretical model provided in the source research.
The signal will show a peak or a step-like feature near the band edge. As the temperature increases, this feature will broaden and its height will decrease.
1. Identify the crossover region: Locate the gate voltage where the current changes most rapidly. This corresponds to the chemical potential crossing the band edge.
2. Perform a curve fit: Use a non-linear least-squares fitting algorithm to match your experimental data to the theoretical crossover function. The function depends on the ratio of T/Delta.
3. Extract Delta: The width of the transition region in the gate voltage is directly proportional to the temperature and inversely proportional to the gap.
4. Extract T: By comparing the signal at different known lattice temperatures, you can determine the effective electronic temperature. If the electronic temperature is higher than the lattice temperature, it indicates Joule heating or other non-equilibrium effects in your device.
This method is highly effective for /blog/category/sensors/ applications, where you might need to monitor the local temperature of a nanoelectronic component with extreme precision.
While this method is powerful, there are several engineering risks and assumptions that must be managed during the prototyping phase.
Risk 1: Signal Magnitude and Noise
The anomaly-induced current is extremely small. The primary risk is that the signal will be buried under the noise floor of your measurement setup.
Mitigation: Use a high-quality lock-in amplifier and ensure that your electrical shielding is impeccable. Even a small amount of electromagnetic interference (EMI) from the laboratory environment can overwhelm the signal.
Risk 2: Substrate Interference
The piezoelectric substrate itself will produce electrical signals when driven. These signals can be much larger than the graphene response.
Mitigation: This is why the transverse measurement is so important. By measuring the current in a direction perpendicular to the SAW propagation, you can significantly reduce the direct piezoelectric signal from the substrate, which primarily flows in the direction of the wave.
Risk 3: Joule Heating
The very act of driving the device with RF power to generate the SAW can cause heating. This changes the electronic temperature (T), which is one of the variables you are trying to measure.
Mitigation: Perform measurements at very low RF power levels. Use a pulsed excitation instead of continuous wave if necessary to minimize the time-averaged thermal load on the graphene.
Assumption 1: Uniformity of the Gap
The method assumes that the bandgap is uniform across the area of the device being probed by the SAW. If the gap varies spatially due to substrate inhomogeneities, the signal will be smeared, making it impossible to extract an accurate Delta.
Engineering Assumption: We assume that using hBN encapsulation provides a sufficiently uniform potential landscape to treat the gap as a constant.
Assumption 2: Small Deformation Limit
The theoretical model assumes that the mechanical deformation is small enough that the linear approximation of the gauge field holds.
Engineering Assumption: We assume that the SAW amplitude is kept within the linear regime to avoid non-linearities that are not related to the parity anomaly.
By following this guide, a lab or startup can move from theoretical physics to a functional, high-precision characterization tool, opening new doors for the development of next-generation graphene-based nanoelectronics.
For related commercial context, explore graphene electronics and turbostratic graphene flakes.
Serious about B2B integration? Test our premium Pulsed Electrical Resistive Carbon Heating turbostratic graphene in your lab. 100g sample packs available now.
Explore More
Discover how rippled graphene pores act as fluidic memristors, enabling advanced synaptic functionalities for the next generation of neuromorphic computing.

Explore how researchers have discovered viscous electron fluid behavior in cadmium, a breakthrough that could revolutionize the future of nanoelectronics.

Discover how helical multilayer graphene creates supermoiré patterns that allow researchers to control electron valley topology for future nanoelectronics.