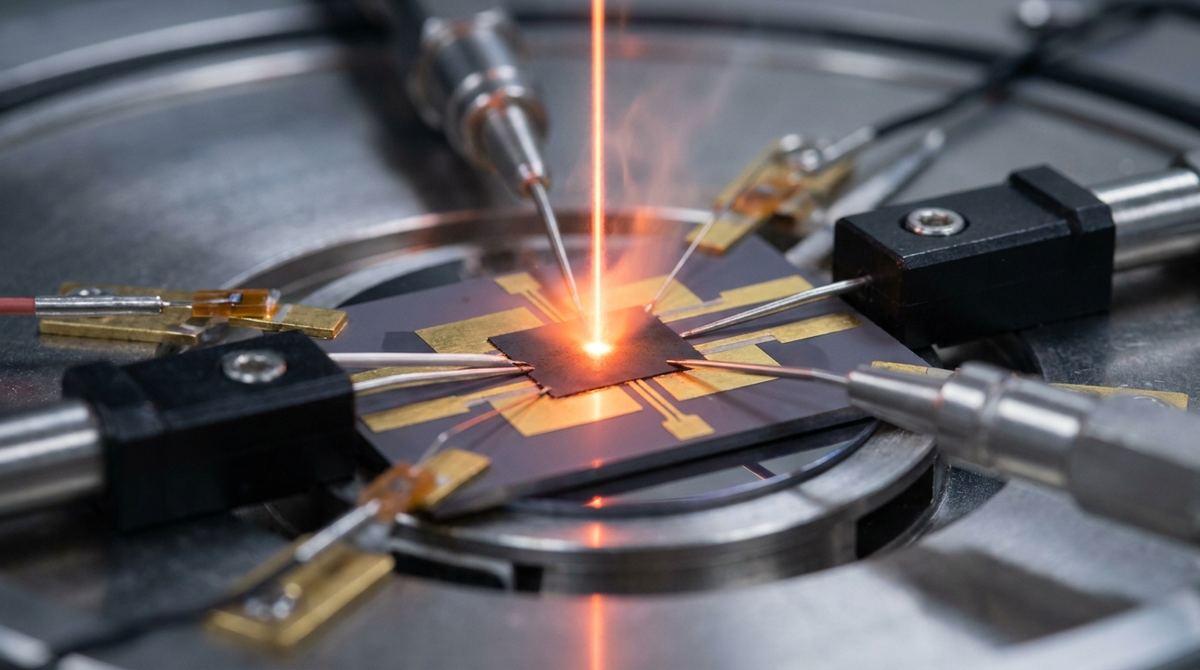
Introduction to Graphene Photothermoelectric Devices
For engineers working on micro-scale energy harvesting or thermal sensing, graphene offers a unique advantage: its ability to convert thermal gradients directly into electrical voltage through the photothermoelectric (PTE) effect. Most standard engineering models rely on the Mott formula to predict how a material will behave when subjected to temperature changes. However, as recent research indicates, the Mott formula is an approximation that only holds true when the temperature is much lower than the Fermi energy.
If you are designing a device intended to operate in high-temperature environments—such as solar-thermal harvesters or industrial heat recovery sensors—the standard Mott approximation will lead to significant errors. Specifically, it fails to account for the fact that the Seebeck coefficient in graphene does not increase indefinitely with temperature; it reaches a maximum. Furthermore, the Wiedemann-Franz law, which relates electrical conductivity to thermal conductivity, can be significantly violated at higher temperatures.
This guide provides a practical framework for building a prototype graphene photothermoelectric generator and testing its performance using more accurate theoretical models.
The Application: Micro-scale Energy Harvesting
The goal is to build a graphene-based photothermoelectric (PTE) generator. This device uses a light source (like a laser or concentrated sunlight) to create a temperature gradient across a thin layer of graphene. Because graphene has high electrical conductivity and can be engineered to have specific thermal properties, it can act as an efficient transducer, converting the heat from the light into a measurable voltage. This is particularly useful for powering micro-electronics in environments where traditional batteries are impractical or for sensing temperature fluctuations in high-heat industrial processes.
Required Materials and Equipment
To build a functional prototype, you will need the following:
- High-quality CVD Graphene: Chemical Vapor Deposition (CVD) graphene transferred onto a silicon dioxide (SiO2) on silicon substrate.
- Substrate: A silicon wafer with a thin layer (typically 285nm to 300nm) of SiO2.
- Contact Metal: Titanium (Ti) and Gold (Au) for electrical contacts.
- Heat Source: A continuous-wave (CW) infrared laser or a micro-heater to create the thermal gradient.
- Heat Sink: A copper block or a high-thermal-conductivity substrate to maintain the cold side of the gradient.
- Measurement Tools: A high-precision Source Measure Unit (SMU) or a Lock-in Amplifier for measuring low-voltage signals.
- Thermal Characterization: An infrared camera or micro-thermocouples to verify the temperature gradient.
Prototype Construction Steps
Building a graphene PTE device requires precision at the micro-scale. While the following steps assume a standard laboratory setup, the process can be adapted for small-scale fabrication facilities.
1. Substrate Preparation: Clean the SiO2/Si substrate using standard RCA cleaning or sonication in acetone and isopropanol to ensure no organic contaminants remain.
2. Graphene Transfer: Use the PMMA-assisted transfer method to place the CVD graphene onto the substrate. Ensure the graphene is continuous and free of wrinkles or polymer residue, as the research indicates that disorder and impurities significantly reduce the thermoelectric figure of merit (ZT).
3. Photolithography and Contact Deposition: Use electron-beam lithography or UV photolithography to define the contact areas. Deposit a thin layer of Titanium (approx. 5-10nm) as an adhesion layer, followed by Gold (approx. 30-50nm) via electron-beam evaporation. This creates the electrical leads necessary to measure the Seebeck voltage.
4. Device Assembly: Mount the substrate on a thermal stage. One side of the graphene should be in contact with a heat sink (the cold junction), while the other side is exposed to the light source (the hot junction).
5. Environmental Control: If testing in air, ensure the environment is stable to prevent convection from interfering with the thermal gradient.
Testing and Characterization Plan
Once the prototype is assembled, you must validate its performance using the advanced transport coefficients described in recent literature.
1. Seebeck Coefficient Measurement: Apply a controlled temperature gradient (Delta T) across the graphene layer using the laser. Measure the resulting open-circuit voltage (V). The Seebeck coefficient (S) is calculated as S = V / Delta T. Note that as you increase the temperature, you should observe the Seebeck coefficient reaching a peak rather than continuing to rise linearly.
2. Electrical and Thermal Conductivity: Measure the electrical conductivity of the graphene layer. To calculate the electronic figure of merit (ZT), you will also need the thermal conductivity. Note that at higher temperatures, you cannot assume the Wiedemann-Franz law holds; you must measure or model the thermal conductivity independently.
3. Figure of Merit (ZT) Calculation: Calculate the dimensionless figure of merit using the formula ZT = (S^2 sigma T) / kappa, where sigma is electrical conductivity, T is absolute temperature, and kappa is thermal conductivity.
4. Radiative Heat Loss Assessment: At higher temperatures, radiative heat transport becomes a significant factor. Use an infrared camera to monitor the temperature distribution and ensure that your calculations account for heat lost to the surroundings via radiation.
Engineering Assumptions and Limitations
Because this guide bridges the gap between theoretical research and practical prototyping, several assumptions must be made:
- Dimensions: For this guide, we assume a device active area of 50 micrometers by 50 micrometers. Smaller dimensions may increase the temperature gradient but increase contact resistance.
- Temperature Range: We assume an operating temperature range of 300K to 500K. Beyond 500K, the degradation of the graphene-substrate interface becomes a significant risk.
- Conductivity Model: We assume a quadratic conductivity model for the graphene, which is a common simplification used in the recent research to provide closed-form expressions.
- Substrate Influence: We assume the SiO2 layer is thin enough to allow for efficient heat dissipation into the silicon substrate, acting as the heat sink.
Critical Risks and Mitigation
1. Material Disorder: The research highlights that disorder (defects, grain boundaries, and impurities) reduces thermoelectric performance. Mitigation: Use high-quality, large-grain CVD graphene and perform rigorous cleaning of the substrate.
2. Thermal Management: If the laser power is too high, you may exceed the thermal limits of the graphene or the substrate, leading to device failure or substrate cracking. Mitigation: Start with very low laser power and increase it incrementally while monitoring the temperature with an IR camera.
3. Wiedemann-Franz Violation: At higher temperatures, the standard relationship between heat and charge transport breaks down. Mitigation: Do not rely on standard semiconductor formulas for your efficiency calculations; use the exact zeta-function series approach or empirical measurements to determine the thermal conductivity.
4. Radiative Heat Loss: In micro-scale devices, heat loss through radiation can be a major factor in the figure of merit. Mitigation: Account for radiative transport in your thermal models to avoid overestimating the device's efficiency.
Source Basis and Theoretical Foundation
This guide is based on the research findings of Villa Cortes et al. (2026), specifically their work on exact thermoelectric transport coefficients in graphene using a finite zeta-function Mott series. Their work provides the mathematical foundation for understanding why graphene's thermoelectric performance behaves non-linearly at higher temperatures. By moving beyond the low-temperature Mott approximation, engineers can more accurately predict the maximum achievable Seebeck coefficient and the upper limits of the electronic figure of merit in clean graphene models.