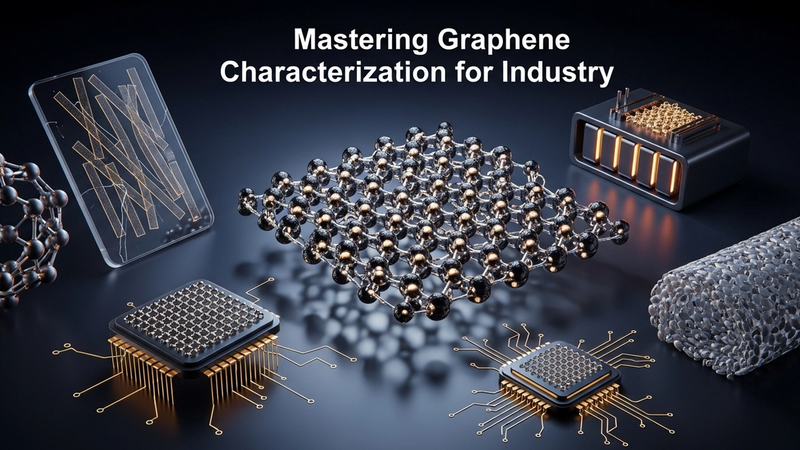
Mastering Graphene Characterization for Industry
Graphene, the single-atom-thick sheet of carbon atoms arranged in a hexagonal lattice, continues to captivate researchers and industries worldwide with its extraordinary properties. Its unparalleled strength, electrical conductivity, thermal performance, and optical transparency promise to redefine numerous technological landscapes, from advanced electronics and energy storage to biomedical devices and high-performance composites. However, realizing these promises hinges critically on the ability to consistently produce and accurately verify the material's structural integrity, purity, and electronic characteristics.
The journey from laboratory discovery to commercial application demands rigorous quality control and a deep understanding of the synthesized material. This necessitates a suite of sophisticated analytical tools capable of probing graphene at various scales, from its atomic arrangement to its macroscopic film properties. Without precise and reliable graphene characterization, optimizing synthesis methods, predicting performance in real-world applications, and ensuring batch-to-batch consistency would be an insurmountable challenge.
This comprehensive overview delves into the primary techniques employed for the surface characterization of graphene, highlighting their principles, capabilities, and the specific insights they provide. From initial visual inspections to atomic-level interrogation, each method contributes a vital piece to the puzzle, enabling scientists and engineers to tailor graphene-based materials for specific, high-performance applications across the industrial spectrum.
The Indispensable Role of Graphene Characterization
The intrinsic properties of graphene, such as its exceptional electrical conductivity, mechanical strength, and thermal stability, are highly dependent on its structural perfection, number of layers, defect density, and surface chemistry. Any deviation from the ideal atomic arrangement or the introduction of impurities can significantly alter its performance, rendering it unsuitable for sensitive applications. Therefore, robust graphene characterization is not merely a research tool but a critical component in the entire product development lifecycle, from fundamental material science to industrial scaling and quality assurance.
Accurate characterization allows researchers to correlate synthesis parameters with material properties, enabling fine-tuning of growth processes for optimized outcomes. For instance, understanding the precise layer count is crucial for electronic applications where single-layer graphene offers distinct advantages. Similarly, identifying defects or oxygen functional groups is paramount when developing transparent conductive films or sensors, as these can impede charge transport or affect surface reactivity. The ability to verify these attributes ensures that the material meets the stringent specifications required for advanced technological integration.
Moreover, comprehensive characterization is essential for establishing industry standards and facilitating the commercialization of graphene-based products. As graphene moves from academic labs to manufacturing facilities, standardized testing protocols are vital for comparing materials from different suppliers and guaranteeing performance consistency. This rigorous approach builds confidence in the material, accelerates adoption, and ultimately drives innovation across diverse sectors, solidifying graphene’s position as a transformative material of the 21st century.
Optical Imaging: A Foundational Step in Graphene Analysis
Optical microscopy serves as a primary, cost-effective, and non-destructive technique for the initial assessment of graphene layers. This method is particularly valuable for quickly identifying the presence of graphene, estimating its lateral dimensions, and often discerning the number of layers, especially when deposited on specific dielectric substrates like silicon dioxide (SiO2) or silicon nitride (Si3N4) on silicon. The visibility of graphene layers under an optical microscope relies on a phenomenon known as Fabry-Perot interference.
When light interacts with graphene on a dielectric surface, reflections occur at both the air-graphene interface and the graphene-substrate interface. These reflected light waves interfere with each other, creating a measurable contrast that varies with the thickness of the graphene film and the underlying dielectric layer. For instance, a single graphene layer, typically around 0.34 nanometers thick, can become surprisingly visible on a 300-nanometer thick SiO2 layer when illuminated with green light. Conversely, thicker graphene sheets might exhibit better contrast on a 200-nanometer SiO2 layer under blue light illumination, demonstrating the interplay between substrate thickness and incident light wavelength.
Researchers like Blake et al. have demonstrated the optimization of this contrast using different narrowband filters, allowing for the detection of varying graphene thicknesses on specific SiO2 supports. While optical microscopy offers immediate feedback and is widely accessible, its primary limitation lies in its resolution, which is restricted by the wavelength of light. It cannot provide atomic-scale detail or precise information about defects or chemical composition, thus necessitating more advanced techniques for deeper characterization. However, as an initial screening tool, it remains indispensable for rapid sample evaluation and manipulation in many research and production environments.
Atomic Force Microscopy (AFM): Unveiling Nanoscale Topography
Atomic Force Microscopy (AFM) is a powerful surface characterization technique that provides high-resolution topographic images of graphene films, capable of resolving features down to the sub-nanometer scale. Unlike optical microscopy, AFM does not rely on light but rather on the direct mechanical interaction between a sharp, cantilever-mounted probe and the sample surface. As the tip scans across the graphene, deflections of the cantilever are recorded, translating into a precise three-dimensional map of the surface morphology.
For graphene, AFM is invaluable for determining the exact number of layers by measuring step heights at the edges of flakes; a single graphene layer typically exhibits an apparent height of approximately 0.34 to 1.0 nanometer on a substrate, depending on interaction forces. This technique can also reveal the presence of wrinkles, folds, tears, and other structural imperfections that arise during synthesis or transfer processes. By mapping these features, researchers can gain critical insights into the quality and integrity of the graphene film, which directly impacts its electronic and mechanical properties.
Beyond simple topography, advanced AFM modes can probe local material properties such as stiffness, adhesion, and electrical conductivity, offering a comprehensive understanding of the graphene surface. For example, conductive AFM (C-AFM) can map variations in electrical current across the graphene sheet, highlighting areas of differing conductivity due to defects or doping. The non-destructive nature of AFM, its ability to operate in various environments (air, liquid, vacuum), and its direct measurement of height make it an essential tool for detailed nanoscale surface characterization of graphene, complementing optical methods with quantitative structural information.
Raman Spectroscopy: The Unique Graphene Fingerprint
Raman spectroscopy stands as one of the most widely used and versatile techniques for the non-destructive characterization of graphene, providing a wealth of information about its structural integrity, electronic properties, and number of layers. This technique relies on the inelastic scattering of monochromatic light, typically from a laser, by molecular vibrations within the material. The scattered light, shifted in energy, produces a unique spectral fingerprint that is highly sensitive to the atomic structure and bonding characteristics of carbon materials.
For graphene, three prominent peaks dominate the Raman spectrum: the G band (around 1582 cm-1), the D band (around 1350 cm-1), and the 2D band (around 2700 cm-1). The G band originates from the in-plane vibrations of sp2-hybridized carbon atoms and is a characteristic feature of all graphitic materials. Its position and sharpness provide information about the strain and doping of the graphene lattice. The D band, conversely, is a defect-activated peak, meaning its presence and intensity indicate the level of disorder, defects, or edge imperfections within the graphene structure. A pristine, defect-free graphene sheet will exhibit a very small or absent D band.
Perhaps most remarkably, the 2D band serves as a highly reliable indicator of the number of graphene layers. Its shape, position, and intensity relative to the G band change distinctly with the number of layers, allowing for precise differentiation between single-layer, bilayer, and few-layer graphene. For instance, single-layer graphene shows a sharp, symmetric 2D peak with a higher intensity than the G peak, whereas bilayer graphene exhibits a broader, four-component 2D peak. The robustness, speed, and non-destructive nature of Raman spectroscopy make it an indispensable tool for quality control, material identification, and understanding the fundamental properties of synthesized graphene films.
Electron Microscopy: Unraveling Graphene's Structure with SEM and HRTEM
Electron microscopy techniques, specifically Scanning Electron Microscopy (SEM) and High-Resolution Transmission Electron Microscopy (HRTEM), offer distinct advantages for visualizing graphene's morphology and atomic structure at different scales. These methods utilize beams of electrons instead of light, enabling much higher magnifications and resolutions than optical techniques, down to the atomic level.
Scanning Electron Microscopy (SEM) provides detailed topographical information of graphene films, revealing larger-scale features such as flake size, shape, uniformity, and the presence of wrinkles or overlapping layers across broader areas. While SEM does not typically resolve individual atoms, it is excellent for observing the overall coverage and quality of graphene films on substrates, identifying growth domains, or detecting macroscopic defects. It is particularly useful for assessing the output of large-scale synthesis methods like chemical vapor deposition (CVD), where film continuity and grain boundaries are important considerations. The relatively straightforward sample preparation and quick imaging capabilities make SEM a valuable tool for initial quality assessment of synthesized graphene.
High-Resolution Transmission Electron Microscopy (HRTEM), in contrast, offers atomic-scale visualization, allowing direct imaging of the hexagonal carbon lattice of graphene. This technique can directly confirm the single-layer nature of graphene, identify atomic defects, characterize grain boundaries, and even visualize the formation of nanoribbons. By observing cross-sectional views or folded edges of graphene sheets, researchers can definitively count the number of layers. HRTEM is crucial for understanding the fundamental structural characteristics that dictate graphene's performance, although it requires meticulous sample preparation and can be susceptible to electron beam damage. The complementary nature of SEM and HRTEM allows for a comprehensive understanding of graphene's structure from the macroscopic to the atomic level.
X-ray Techniques: XPS and XRD for Compositional and Structural Insights
X-ray based characterization techniques, namely X-ray Photoelectron Spectroscopy (XPS) and X-ray Diffraction (XRD), provide crucial information about the elemental composition, chemical bonding states, and crystalline structure of graphene and graphene-based materials. These methods are essential for understanding the surface chemistry and overall crystallinity, which are vital for many applications.
X-ray Photoelectron Spectroscopy (XPS) is a surface-sensitive quantitative spectroscopic technique that measures the elemental composition, empirical formula, chemical state, and electronic state of the elements within a material. For graphene, XPS is particularly powerful for identifying the presence of oxygen functional groups, which are prevalent in graphene oxide (GO) and reduced graphene oxide (RGO). By analyzing the C1s photoelectron peak, researchers can differentiate between sp2 carbon (C-C bonds), C-O (hydroxyl, epoxy), C=O (carbonyl), and O-C=O (carboxyl) bonds. This chemical state information is critical for assessing the degree of reduction in RGO or for understanding surface functionalization, directly impacting properties like electrical conductivity and biocompatibility.
X-ray Diffraction (XRD), on the other hand, is primarily used to determine the crystallographic structure of a material, including the lattice parameters, crystallite size, and preferred orientation. For graphene and related carbon materials, XRD provides insights into the interlayer spacing (d-spacing) between graphene sheets and the overall crystallinity. A sharp (002) diffraction peak at approximately 26 degrees (2-theta) indicates well-stacked graphitic layers, while a broader, shifted peak is characteristic of exfoliated graphene or graphene oxide with increased interlayer spacing and reduced stacking order. While XRD may not directly confirm single-layer graphene, it is invaluable for distinguishing between few-layer graphene, graphite, and highly disordered carbon, offering a bulk structural perspective that complements surface-sensitive techniques.
Fluorescence Quenching Microscopy (FQM): A Specialized Imaging Approach
Fluorescence Quenching Microscopy (FQM) offers a specialized and often low-cost, time-saving method for imaging graphene, graphene oxide (GO), and reduced graphene oxide (RGO) sheets. This technique leverages the unique electronic properties of graphene to selectively quench the fluorescence of certain dyes. The fundamental principle involves coating the graphene or graphene oxide samples with a fluorescent dye. When light excites the dye, it typically emits fluorescence; however, if the dye molecules are in close proximity to a graphene sheet, the energy from the excited dye can be efficiently transferred to the graphene, leading to a significant reduction or “quenching” of the fluorescence emission.
The mechanism behind this quenching is often attributed to non-radiative energy transfer, where graphene acts as an efficient electron acceptor or energy sink. This interaction creates a distinct contrast between the graphene-covered areas (where fluorescence is quenched) and the bare substrate (where the dye fluoresces normally). This visual differentiation allows for immediate sample evaluation and manipulation, which can be particularly helpful during the development and optimization of synthesis processes for GO and RGO. After imaging, the dye can typically be removed by rinsing without disrupting the integrity of the graphene sheets, making it a reversible and non-invasive technique.
FQM has proven especially useful for visualizing GO and RGO due to their inherent chemical interactions with various dyes and their often non-uniform dispersion. The appearance of contrast is directly linked to the chemical interaction between the graphene material and the dye, providing a rapid visual assessment of material distribution and quality. While not providing atomic resolution, FQM offers a practical and accessible method for immediate feedback in laboratory settings, aiding in the swift refinement of synthesis and processing protocols for graphene-based materials.
Frequently Asked Questions About Graphene Characterization
Q1: Why is comprehensive graphene characterization so critical for commercial applications?
A1: Comprehensive graphene characterization is critical because graphene's performance is highly sensitive to its structural quality, layer count, and surface chemistry. Accurate characterization ensures consistent material properties, validates synthesis methods, enables quality control for production, and builds confidence in the material's suitability for specific industrial applications, preventing costly failures and accelerating innovation.
Q2: What specific information can optical microscopy provide about graphene samples?
A2: Optical microscopy provides initial, rapid insights into the presence, lateral dimensions, and estimated number of graphene layers, particularly when deposited on silicon dioxide substrates. It utilizes Fabry-Perot interference to create contrast, with visibility dependent on the dielectric layer thickness and incident light wavelength. It serves as a cost-effective first-pass assessment for sample evaluation.
Q3: How does Raman spectroscopy definitively identify the number of graphene layers?
A3: Raman spectroscopy identifies graphene layers by analyzing the unique characteristics of its 2D band. Single-layer graphene exhibits a sharp, symmetric 2D peak with a higher intensity than the G peak. As the number of layers increases, the 2D peak broadens, shifts, and often splits into multiple components, providing a clear spectroscopic fingerprint for precise layer determination.
Q4: What are the primary contributions of Atomic Force Microscopy (AFM) to graphene characterization?
A4: AFM primarily contributes high-resolution topographic imaging of graphene surfaces, enabling precise measurement of layer thickness and identification of wrinkles, folds, and other nanoscale morphological features. It can also be used to probe local mechanical and electrical properties, offering detailed insights into the material's surface integrity and homogeneity at the nanoscale.
Q5: What unique insights do XPS and XRD offer for graphene-based materials?
A5: XPS (X-ray Photoelectron Spectroscopy) provides elemental composition and crucial chemical state information, such as the types and quantities of oxygen functional groups in graphene oxide or reduced graphene oxide. XRD (X-ray Diffraction) determines the crystallographic structure, interlayer spacing, and overall crystallinity, differentiating between highly ordered graphitic structures and disordered or exfoliated graphene materials.
Conclusion
The journey to fully harness the extraordinary potential of graphene is intrinsically linked to our ability to precisely characterize this two-dimensional material. The diverse array of techniques, from the foundational optical microscopy to advanced electron microscopy, spectroscopy, and X-ray analysis, collectively provides an unparalleled toolkit for understanding graphene’s structure, composition, and properties at every scale. Each method offers unique insights, and a multi-technique approach is often necessary to obtain a complete and robust characterization profile, essential for both fundamental research and industrial deployment.
As the graphene industry matures, the continued refinement and standardization of these graphene characterization methods will be paramount. Accurate, reliable, and efficient characterization ensures quality control, accelerates material optimization, and ultimately drives the successful integration of graphene into next-generation technologies. To learn more about the latest advancements in graphene materials and their characterization, visit usa-graphene.com and explore our comprehensive resources and industry insights.
Evaluate Our Quality
Serious about B2B integration? Test our premium Pulsed Electrical Resistive Carbon Heating turbostratic graphene in your lab. 100g sample packs available now.